1. 主题设置
1.1 一套常用主题
mytheme <- theme(panel.grid.major = element_line(colour = "grey85", size = 0.25),
panel.grid.minor = element_line(colour = "grey85", size = 0.25),
panel.background = element_blank(),
panel.border = element_rect(fill=NA,color = "black"),
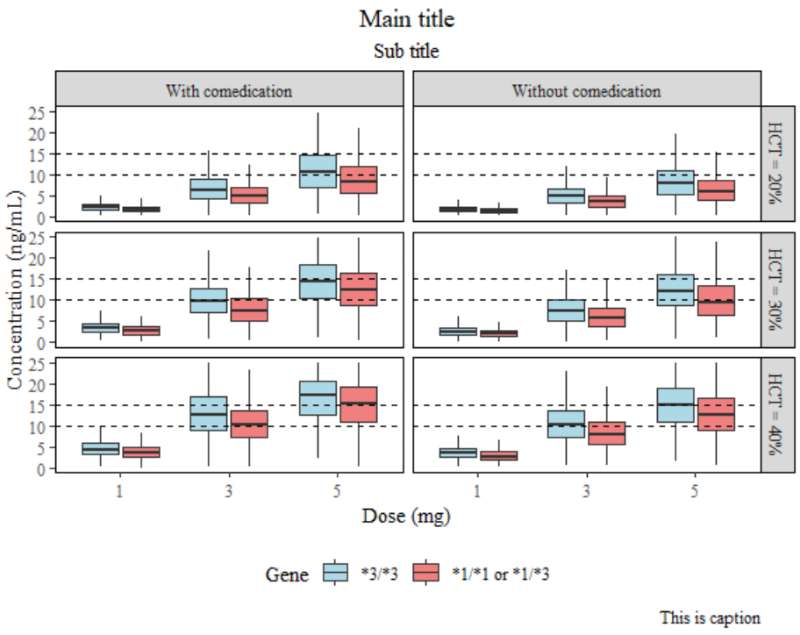
plot.title = element_text(hjust = 0.5),
plot.subtitle = element_text(hjust = 0.5),
plot.caption = element_text(),
legend.position = "bottom",
legend.key = element_blank(),
strip.background = element_rect(color = "black"))
复制代码
1.2 画板(Panel)
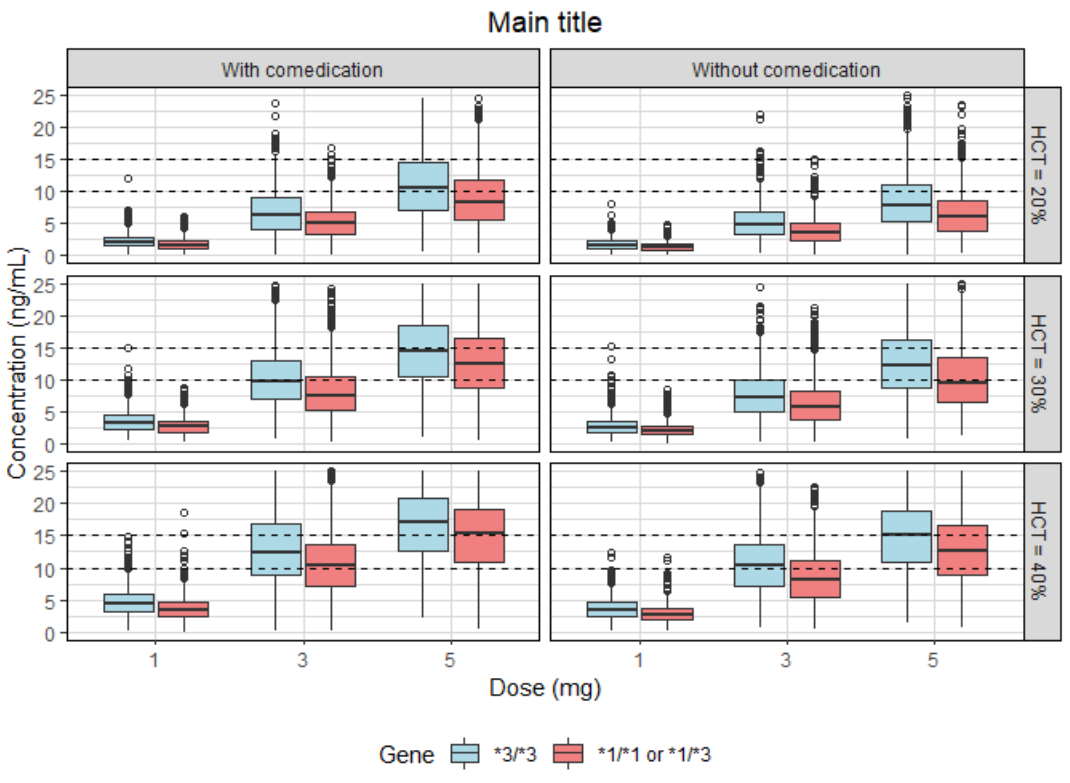
panel.grid.major = element_line(colour = "grey85", size = 0.25)
panel.grid.minor = element_line(colour = "grey85", size = 0.25)
panel.grid = element_blank()
panel.background = element_blank()
panel.border = element_rect(fill=NA,color = "black")
复制代码
1.3 条带(Strip)
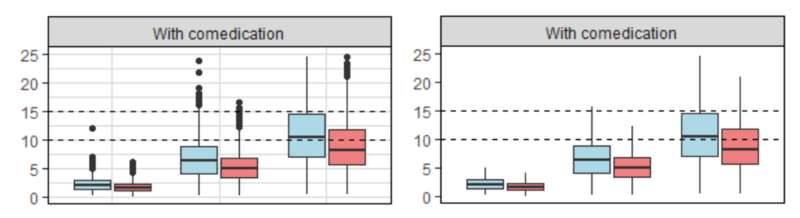
strip.background = element_rect(color = "black")
strip.background.x = element_rect(color = "black",fill = "white")
strip.background.y = element_rect(color = "black")
strip.placement = "outside"
复制代码
1.4 图例(Legend)
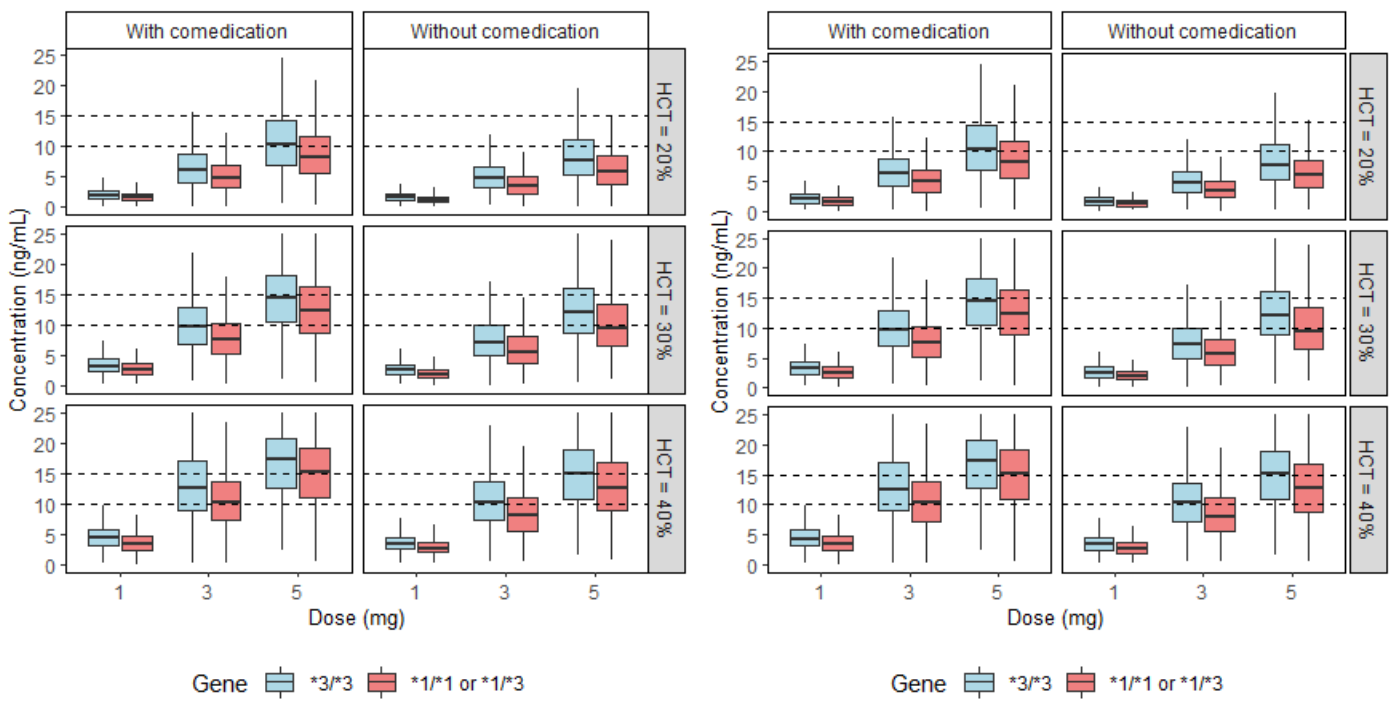
legend.position = "bottom"
legend.key = element_blank()
legend.background = element_rect(color = "black")
复制代码
1.5 字体字号
windowsFonts(Times=windowsFont("Times New Roman"))
text = element_text(family="Times", face="bold", size=12)
plot.title = element_text(hjust = 0.5)
plot.subtitle = element_text(hjust = 0.5)
plot.caption = element_text()
axis.title.x = element_text(size = 10)
strip.text.y = element_text(size = 10)
复制代码